Luton Driving Test Centre Pass Rate 2024-25
Luton driving test centre returned a 40.1% pass rate in 2024-25 on 8,304 practical car tests, placing it 8.6 percentage points below the national average of 48.7%. The centre has improved steadily from its recorded low of 33.5% in 2017-18 but remains one of the lower-ranked sites in the East of England. Nearby centres including Letchworth (58.3%) and Leighton Buzzard (51.0%) post considerably higher rates for candidates with options.
- Pass rate 2024-25
- 40.1%on 8,304 tests at Luton
- Below UK average
- -8.6ppnational average 48.7%, 2024-25
- First-time pass rate
- 37.2%on 3,811 first-attempt candidates
- Gender gap
- 6.0ppmen 43.0% vs women 37.0%, 2024-25
The 2024-25 result in context
At 40.1%, Luton sits 8.6 percentage points below the UK national average of 48.7% for 2024-25. Among the 263 high-confidence car test centres (those conducting at least 1,000 tests in the year), this places Luton in roughly the bottom fifth of the national ranking. The 8,304 tests conducted in 2024-25 give the headline figure enough statistical weight to reflect real centre conditions rather than random variation: the 95% confidence interval is approximately plus or minus 1.1 percentage points on either side of 40.1%.
The first-time pass rate at Luton in 2024-25 is 37.2%, based on 3,811 candidates sitting the practical test for the first time. That is 2.9 percentage points below the overall 40.1%, which is a fairly typical gap. At most centres the overall rate exceeds the first-time rate because retakers bring additional test experience. The 2.9-point gap at Luton is modest, suggesting retake candidates are not gaining a large advantage here, possibly because the test routes and conditions do not change substantially between attempts.
Pass rate by gender at Luton
Male candidates at Luton passed at 43.0% in 2024-25, based on 4,261 tests. Female candidates passed at 37.0%, based on 4,043 tests. The resulting gender gap of 6.0 percentage points is considerably wider than the national average gap of approximately 2 percentage points. The volume of tests from male and female candidates is roughly even, so the gap is not a small-sample artefact. Whether this reflects differences in test preparation, the types of roads used on Luton routes, or other local factors is unclear from the published data alone, but a 6-point gap is worth noting for any candidate planning their preparation strategy.
Luton's pass rate since 2007-08
Luton's highest recorded pass rate is 44.0%, set in 2007-08. The centre reached its lowest point at 33.5% in 2017-18, a decline of more than 10 percentage points over a decade. Since then, rates have recovered. The 2024-25 figure of 40.1% is a meaningful improvement on the low but still falls short of the 2007-08 peak. The aggregate across all recorded years totals approximately 170,134 tests, with an average of around 39%. That long-run average is consistent with the recent trend: Luton has historically performed below the national average, and the gap widened noticeably from the mid-2010s before the more recent recovery.
Nearby test centres with higher pass rates
For candidates in Luton who are willing to travel, several nearby centres post noticeably higher pass rates. Letchworth, about 10.7 miles away, returned 58.3% in 2024-25 on a robust 5,032-test sample. That is an 18.2-percentage-point advantage over Luton. Leighton Buzzard, about 11 miles to the south-west, returned 51.0% on 7,529 tests. St Albans, 9.3 miles away, returned 48.4% on 6,881 tests, close to the national average. Even Stevenage, at 9.0 miles, returned 44.9% on 4,208 tests, 4.8 points ahead of Luton. The pattern suggests that the roads used on Luton test routes are genuinely more demanding than those at neighbouring centres.
What the Luton test route involves
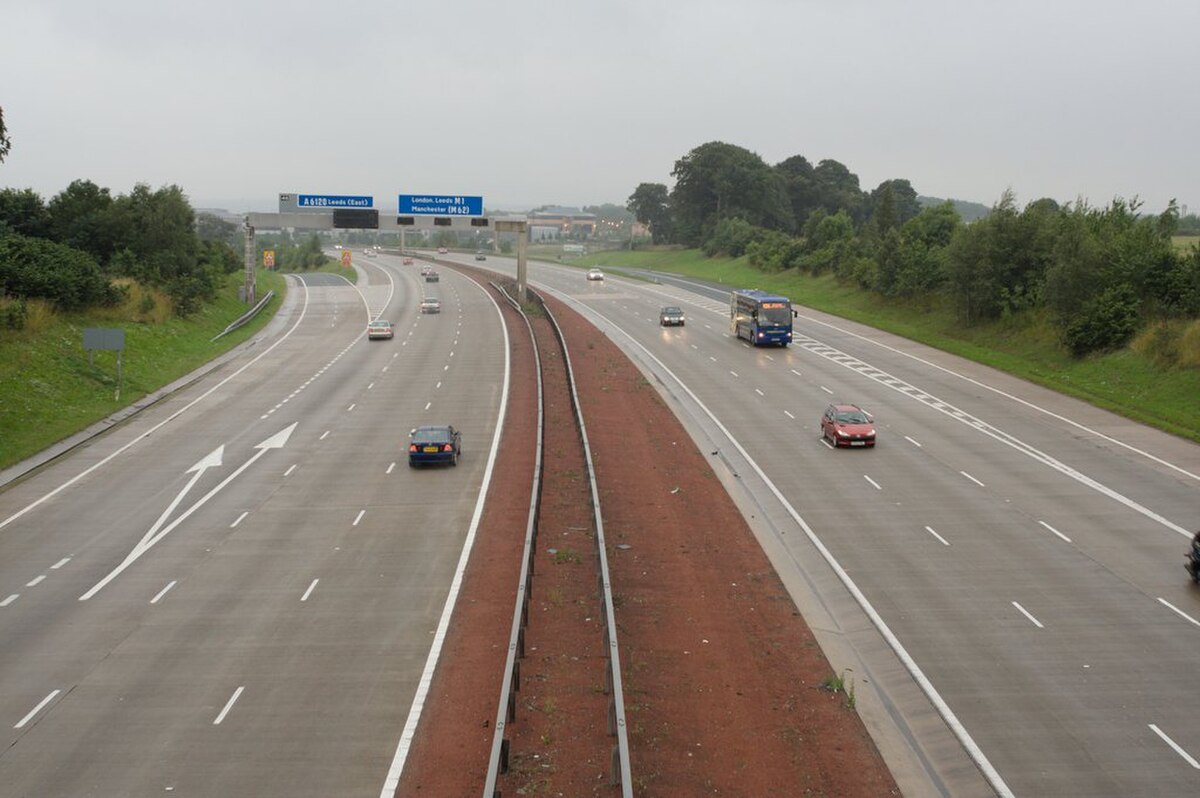
Luton is a busy commercial and commuter town in Bedfordshire, with road characteristics that explain much of the below-average pass rate. The test area includes multi-lane roundabouts, busy A-roads, sections with heavy goods vehicle and airport traffic, and residential streets around the town centre with dense parked-car environments. The proximity of Luton Airport creates localised peaks in traffic volume at certain times, particularly on routes leading through Wigmore and Stopsley to the east. Candidates who prepare on quieter rural or suburban roads and then sit their test in Luton often find the volume and complexity of traffic higher than expected. Instructors in the area consistently recommend high repetition on the busier approach routes rather than accumulating miles on quieter circuits.
The test also uses roads to the north of the town, including parts of the A505 and the junctions approaching the Vauxhall plant area. These sections combine higher road speeds with complex lane-changing requirements. Candidates who have practised motorway-standard driving on A-roads and can manage lane positioning confidently under time pressure are better placed for the Luton test environment than those whose preparation has been limited to lower-speed residential driving.
How to prepare for your test at Luton
- 01Drive the busier routes repeatedly
The roads most likely to appear on a Luton test include the A505 corridor, Crawley Green Road and the approaches through Stopsley. Practise these routes at peak times rather than only in quieter periods to build genuine confidence with traffic density.
- 02Practise multi-lane roundabouts
Luton's road network includes several roundabouts with two or three entry lanes. Candidates who have only practised single-lane roundabouts often position incorrectly at these junctions. Ask your instructor to cover the Kimpton Road area and the roundabouts on the A505.
- 03Build mirror-use habits in heavy traffic
Observation at junctions is the leading fault type nationally, and in high-volume urban environments like Luton it is particularly scrutinised. In busy traffic conditions it can feel rushed to check mirrors thoroughly, but skipping checks is the most common reason candidates receive serious faults at busy centres.
- 04Book your slot with wait times in mind
Luton is a high-volume centre with 8,304 tests in 2024-25. Wait times at busy centres tend to run longer than at smaller rural sites, particularly in the August to November peak period. Check availability early and monitor DVSA cancellations if your preferred slot is weeks away.
- 05Consider nearby centres if you have flexibility
If you have not yet committed to Luton and your instructor covers the wider area, Letchworth at 10.7 miles returned a 58.3% pass rate in 2024-25 on a robust sample. The route environment there is less intense, which translates directly into the 18.2-point gap in pass rates.
Sources and further reading
The figures, fees, and procedures referenced in this article are verifiable on the official gov.uk pages below. PassRates.uk is built on the Driver and Vehicle Standards Agency’s open data, published under the Open Government Licence.
What is the pass rate at your test centre?
Search by centre name, town or postcode to see the latest DVSA figure.
Frequently asked questions
What is the pass rate at Luton driving test centre?
Luton driving test centre returned a pass rate of 40.1% in 2024-25, based on 8,304 practical car tests. That is 8.6 percentage points below the UK national average of 48.7% for the same year.
Is Luton a hard place to pass the driving test?
Yes, by the published data. Luton sits in roughly the bottom fifth of the 263 high-confidence UK car test centres for 2024-25. The busy commercial road network, multi-lane roundabouts and airport-related traffic volumes contribute to a test environment that is more demanding than smaller or more rural sites.
What are the nearest easier test centres to Luton?
Letchworth, about 10.7 miles away, returned 58.3% in 2024-25, an 18.2-point advantage over Luton. Leighton Buzzard (11 miles) returned 51.0% and St Albans (9.3 miles) returned 48.4%. All three have enough tests in the sample to make the comparison statistically reliable.
How does the gender pass rate split at Luton?
Male candidates at Luton passed at 43.0% and female candidates at 37.0% in 2024-25, a gap of 6.0 percentage points. The national gender gap is approximately 2 percentage points, so Luton's gap is notably wider than the UK average.
Every candidate behind these numbers passed a theory test first. Nationally 44.8% of attempts clear it.
Licence, insurance, MOT, vehicle tax and what the law requires you to hold. All 14 DVSA topics are free to practise, with no sign up. See the theory pass rate by centre or the full practice hub.
Related guides
- London and regional analysisEasiest London centreRead guide
- London and regional analysisEasiest Manchester centreRead guide
- London and regional analysisManchester vs LiverpoolRead guide
- London and regional analysisEasiest Newcastle centreRead guide
- London and regional analysisEasiest Sheffield centreRead guide
- London and regional analysisEasiest Edinburgh centreRead guide
Written by Vikas and the PassRates.uk team. Vikas is the software engineer and driving enthusiast who started the site. The figures come straight from the DVSA open dataset; see the methodology.
Source DVSA, Open Government Licence v3.0
Continue reading
Greenford (Horsenden Lane) driving test centre returned a 40.5% pass rate in 2024-25 on 7,106 tests, 8.2 percentage points below the UK national average. Historical trends, gender breakdown, nearby centre comparison and preparation advice for west London candidates.
Northampton driving test centre returned a 50.4% pass rate in 2024-25 on 12,825 tests, 1.7 percentage points above the national average of 48.7%. Full pass rate history, gender breakdown, nearby East Midlands centre comparison and preparation advice.